Create & Run an Experiment
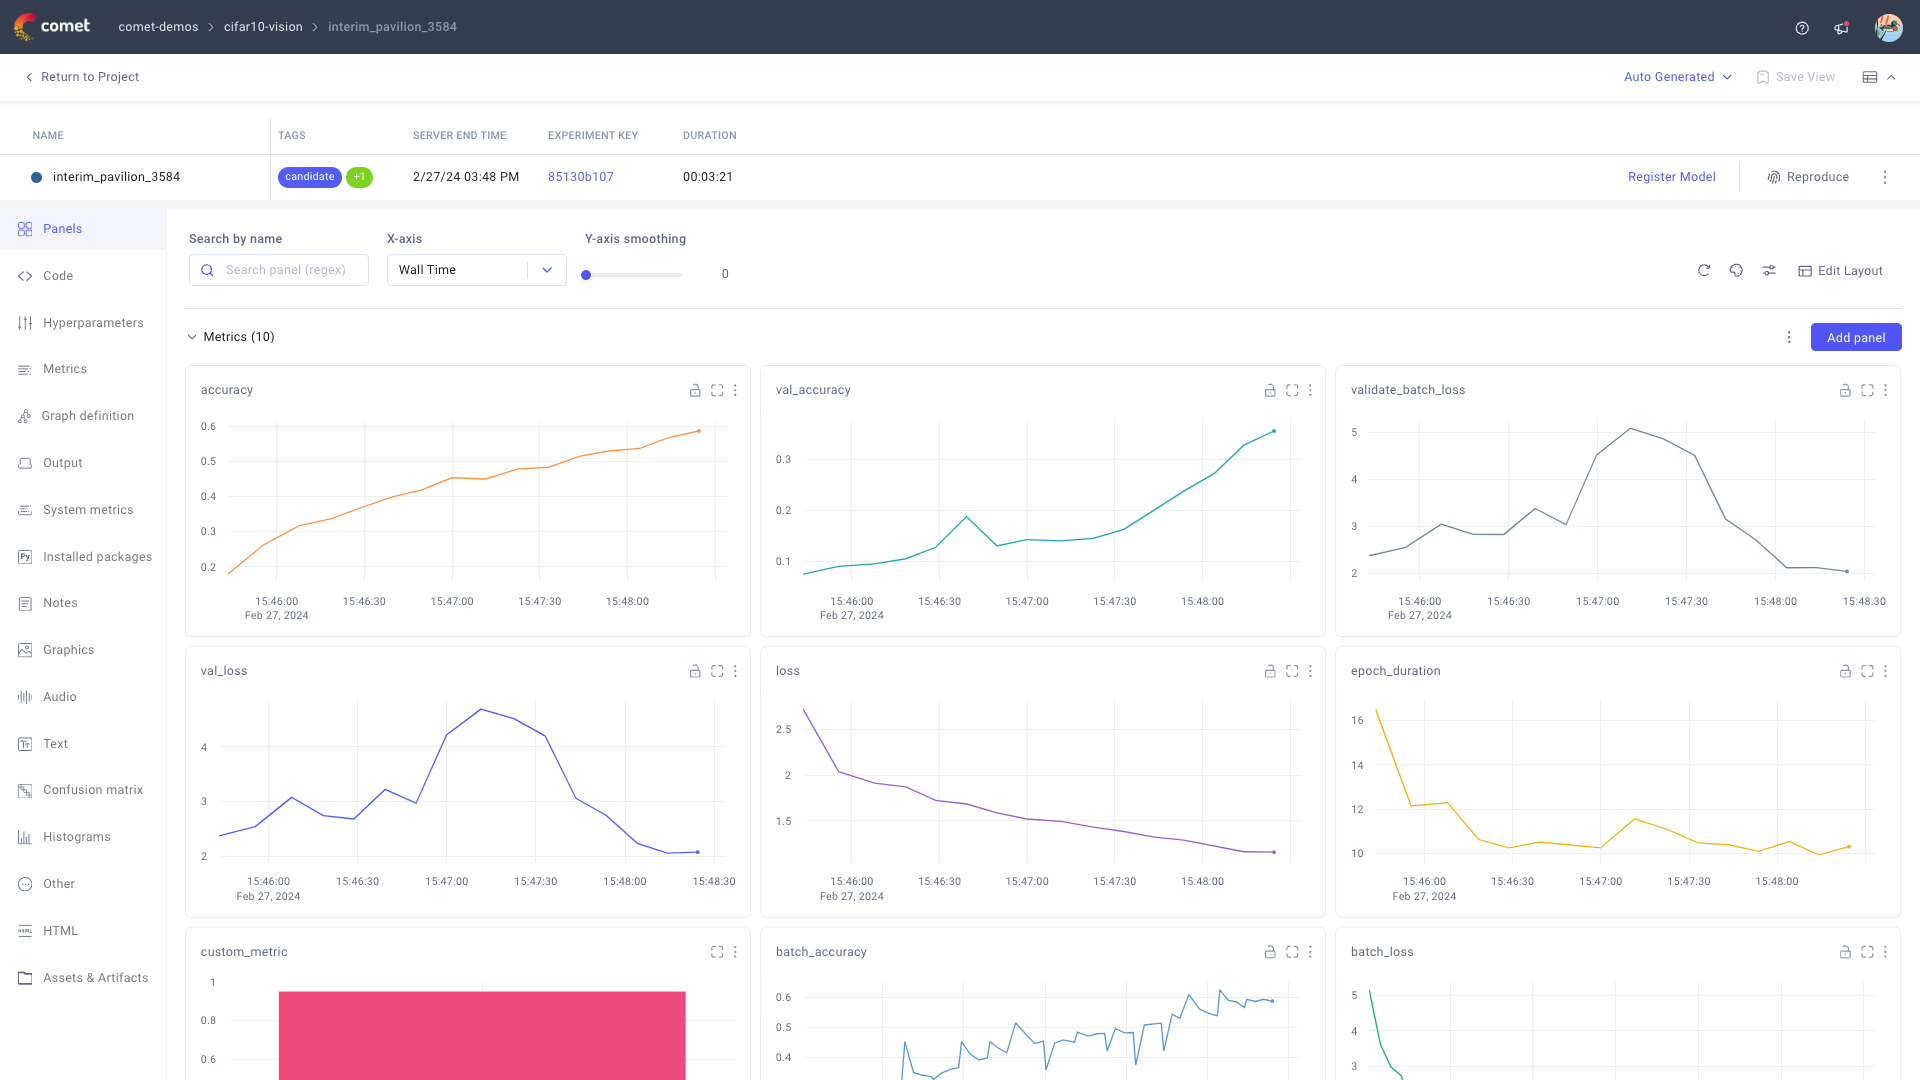
When you create and run an Experiment with Comet, you unlock the ability to interactively analyze the Experiment performance and manage its state over time.
Create an Experiment
When you create an Experiment, Comet instantly begins tracking all attributes associated to the code execution at the url displayed after Experiment creation.
You can create an experiment by running:
1 2 3 4 | |
The comet_ml.login() command will prompt you for your API key if it hasn't been saved already. You can learn about how to configure your API key in Configure the Comet SDK.
If you don't specify any arguments, Comet creates the experiment if your default workspace and the general project.
Alternatively, you can pass relevant arguments to the comet_ml.Experiment() method, e.g. to specify project name and workspace where to create the experiment as well as the automated Comet logging to set up for it.
Log metrics, parameters, and assets to your Experiment
Once an Experiment has been started, Comet will automatically start logging:
- Metrics and hyper-parameters thanks to our many integrations.
- The code file your Experiment was created in.
- The git commit and git patch (uncommitted files) if you are running within a git repository.
- Console output logs.
- Installed python packages.
- System metrics (Memory usage, GPU usage, etc).
In addition to all the data Comet logs for you, you can log any other types of data to the Comet platform using one of our logging methods.
In the example below we log a metric and an image:
1 2 3 4 5 6 7 8 9 10 11 12 13 14 15 16 17 18 19 | |
Comet automatically associates my_metric, my_parameter, and my_image.png to the Experiment represented by the exp object.
Tip
You can use the exp.test() and the exp.train() methods to specify a context to the logged attributes (e.g., a metric logged in the train context is saved with a "train " prefix).